Supermarket Sales Performance Analysis
This project presents an end-to-end analysis of a food-product sales dataset, combining SQL for data preparation and analysis, with Tableau for visualization and insight generation. The goal was to understand which products and categories drive revenue, how sales behave over time, and what patterns can support business decision-making for inventory, pricing, and demand planning
Problem Definition
The business questions guiding the analysis were:
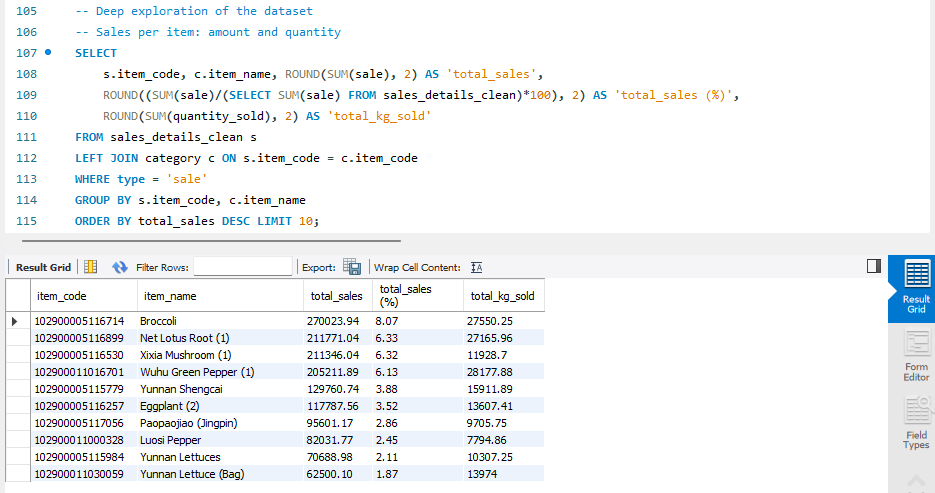
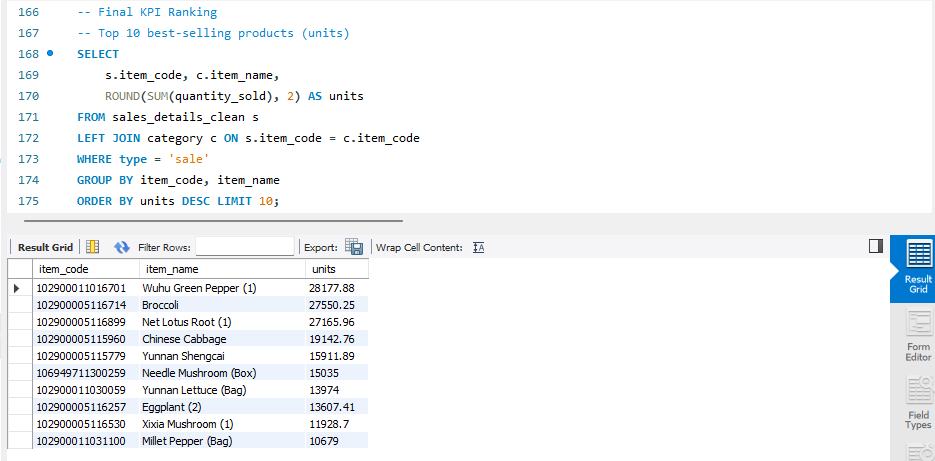
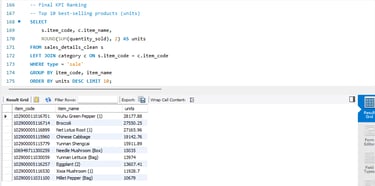
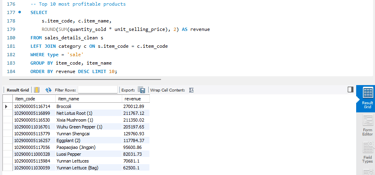
Which items generate the highest sales volume and revenue?
How do sales vary across product categories?
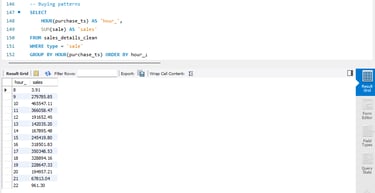
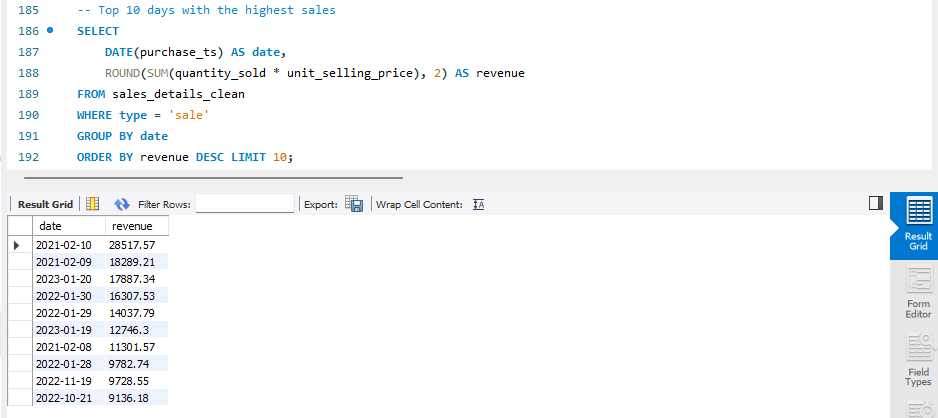
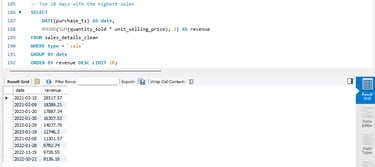
Are there identifiable high-demand periods or seasonal trends?
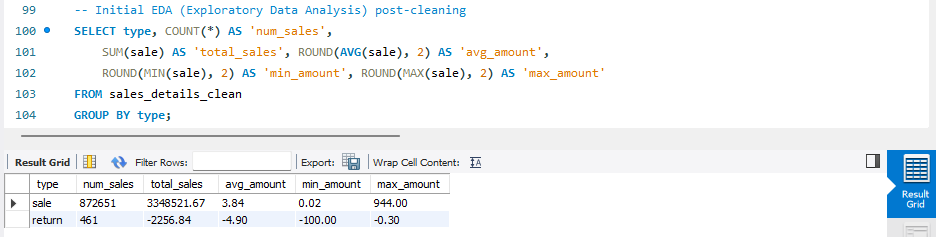
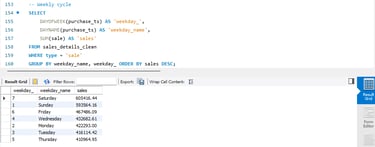
What days and product types contribute most to overall sales performance?
Answering these questions would help stakeholders optimize procurement, product assortment, and promotional strategies
SQL & Tableau Project
Project Overview
This project focuses on analyzing over 878,000 supermarket transactions across multiple food categories. Using SQL for data cleaning and analysis, followed by Tableau for visualization, the objective was to identify the top-performing products and categories, understand seasonal and weekly sales patterns, and uncover insights to support revenue optimization and inventory planning
The workflow included:
Raw data assessment and cleaning
Removal of duplicates
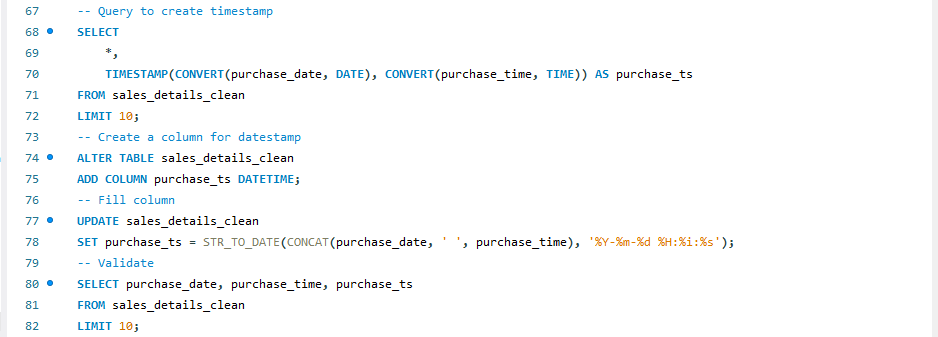
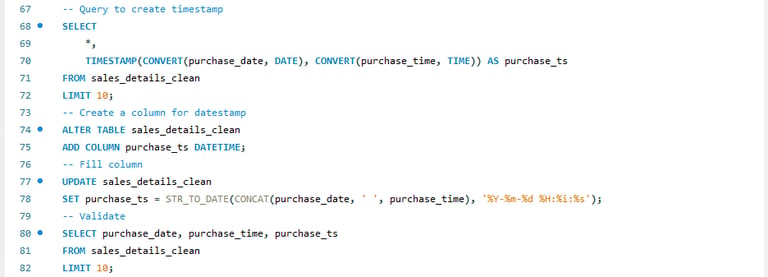
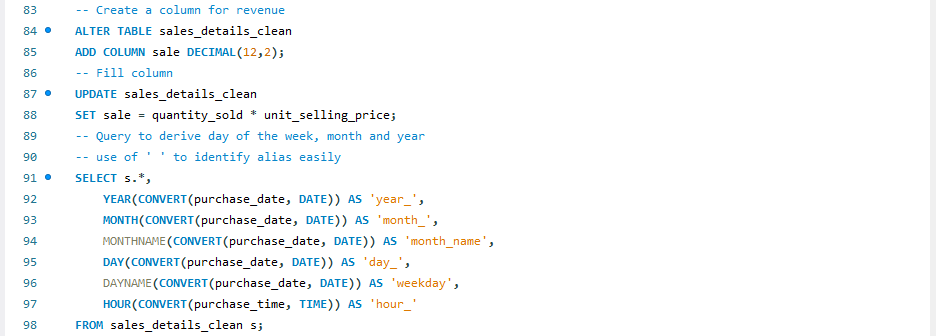
Feature engineering (timestamps, revenue metrics)
Exploratory and descriptive SQL analysis
Exporting curated datasets to Excel
Dashboard construction in Tableau
Executive insights for business decision-making
Methodology Summary
1. Data Cleaning & Validation (MySQL)
Removal of duplicates
Casting date/time fields
Standardization of item/category references
Feature engineering
2. Exploratory SQL Analysis
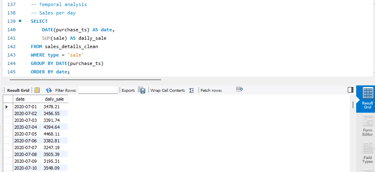
Daily/weekly/monthly revenue
Units sold by category and product
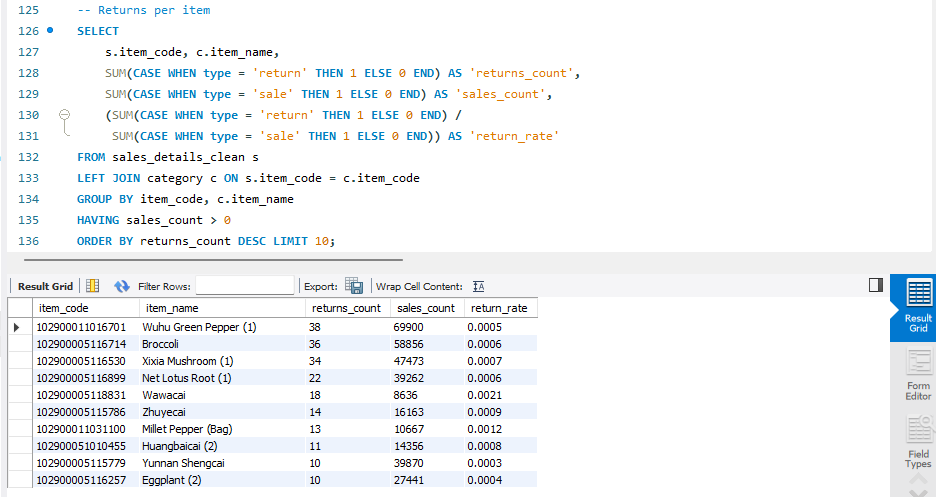
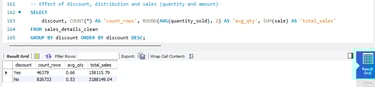
Discount effects
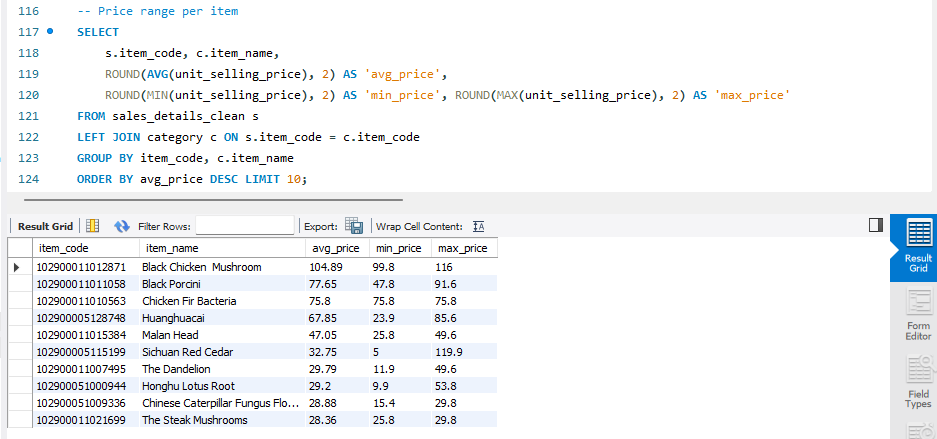
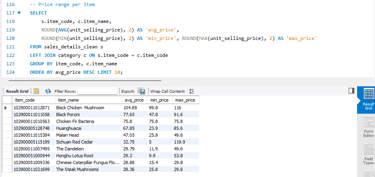
Selling price vs wholesale price
3. Data Export
Creation of clean analytical tables for Tableau
4. Visualization & Storytelling
Interactive dashboard with filters for time, product, and category
Insights presented through KPIs, bar charts, trend lines, and heatmaps
SQL queries
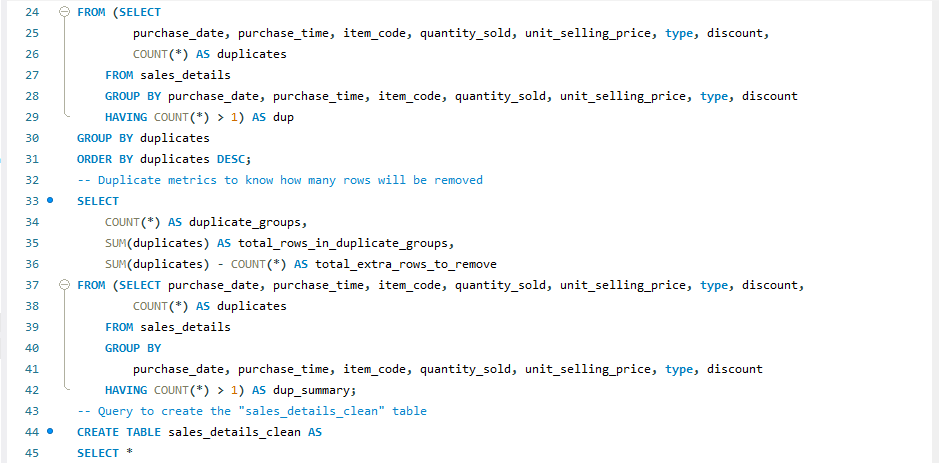
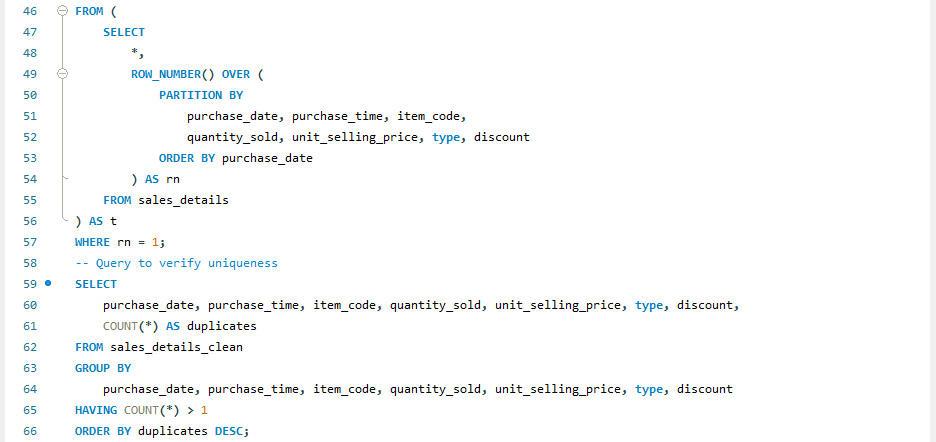
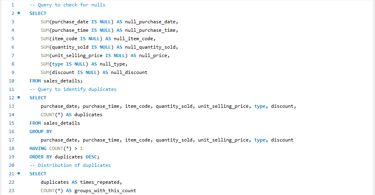
Data Cleaning SQL queries
Feature Engineering Queries
Exploratory Analysis Queries