Revenue & Profitability Dashboard
Revenue growth alone does not guarantee business success
What truly drives sustainable performance is the relationship between revenue, profitability, product mix, and pricing strategy. This project transforms transactional sales data into a strategic profitability dashboard designed to answer a critical question:
Using structured data modeling and visual analytics, this dashboard enables decision-makers to move beyond surface-level revenue tracking and toward margin-driven insights
Problem Definition
Many organizations focus heavily on revenue and units sold as primary performance indicators. However, this approach often hides critical risks:
High-revenue products may generate low margins
High-volume products may dilute profitability
Pricing strategies may increase sales but compress gross margin
Performance trends over time may signal structural issues in product mix
The business challenge was to:
Identify true profit drivers
Understand how revenue and margin evolve over time
Compare high-volume vs high-profit products
Evaluate pricing behavior and markup dynamics
Provide actionable insights for strategic decision-making
From Sales Performance to Profit Intelligence
Project Overview
The dashboard integrates five analytical components:
Core KPIs – Global performance snapshot
Revenue, Gross Profit & Gross Margin Over Time – Trend and structural evolution
Top 10 Products by Gross Profit – Profit concentration analysis
Top 10 Products by Quantity Sold – Volume-driven dynamics
Average Selling Price & Price Markup Over Time – Pricing behavior and margin sustainability
Each layer progressively refines the story — moving from macro performance to product-level strategy and finally to pricing mechanics
Are we growing profitably — and which products are truly driving value?

Between 2020 and 2023, the business generated over $3.3M in revenue and sold more than 466,000 kg of product.
But revenue scale alone does not determine performance quality.
A 36.91% average gross margin indicates that the business retained nearly ¥0.37 per RMB (Renminbi) of revenue after direct costs
From a strategic standpoint:
This margin level suggests value creation, not structural erosion
The business is not operating on thin margins
Profitability is meaningful relative to total revenue
However, margin must be evaluated dynamically — not only in aggregate
The key question becomes:
Was margin stable during growth phases — or did revenue expansion compress profitability?
To answer this, we move to time-series analysis
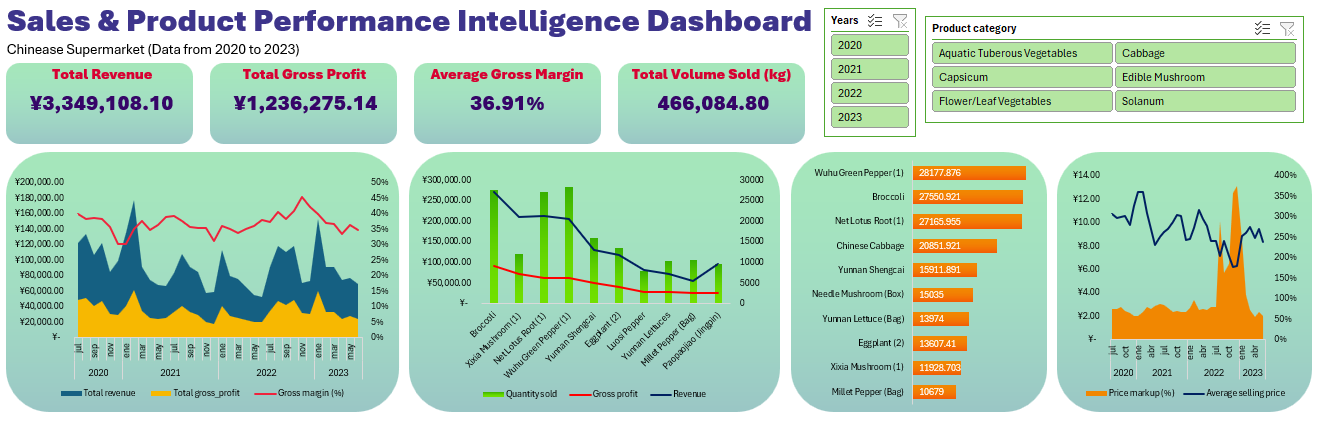
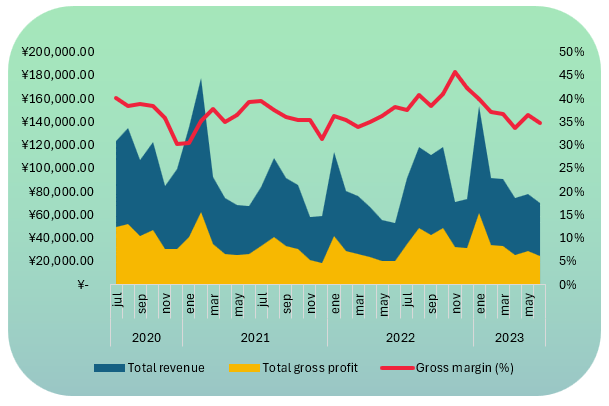
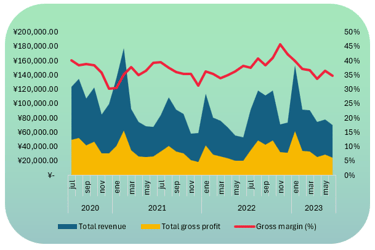
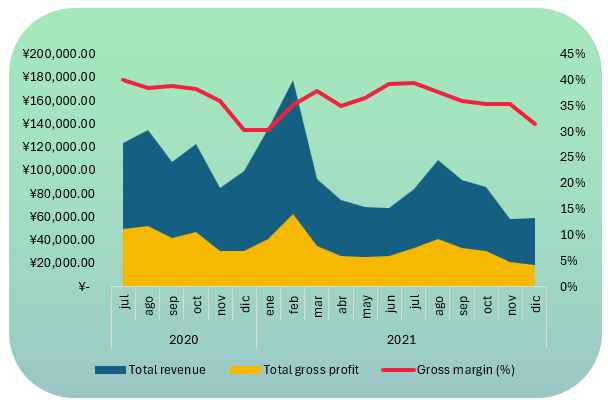
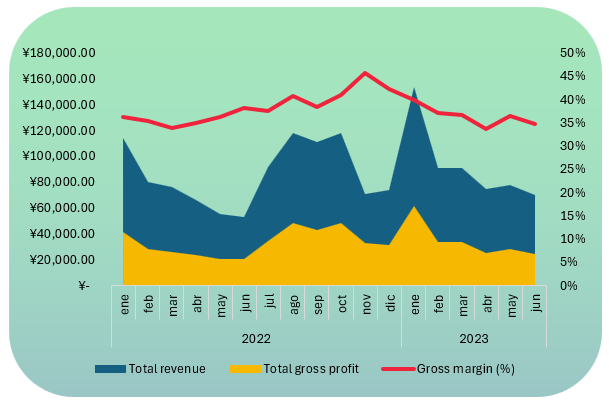
Revenue, Gross Profit & Gross Margin Over Time
Structural Observations
Revenue and gross profit follow the same directional trend
Gross profit remains consistently lower than revenue (as expected)
Revenue peaks are not aligned with margin peaks
Critical Periods Identified
December 2020 – February 2021
Highest revenue levels
Lowest gross margin levels
November 2022 – January 2023
Highest gross margin levels
Revenue decreased
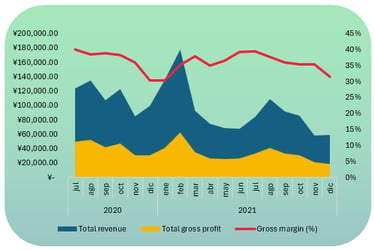
Revenue Growth Was Partially Margin-Dilutive
During high-revenue periods (Dec 2020 – Feb 2021), margin declined.
This typically indicates:
Discounting strategies
Volume-driven sales push
Competitive pricing pressure
Higher input costs not transferred to price
The company grew, but at lower profitability efficiency
Margin Expansion Occurred During Revenue Contraction
Between Nov 2022 and Jan 2023:
Revenue declined
Margin increased to its highest level
This suggests:
Improved pricing discipline
Better cost control
Shift toward higher-margin products
Reduced discount intensity
This period reflects quality growth, not volume growth
Top 10 Products by Gross Profit
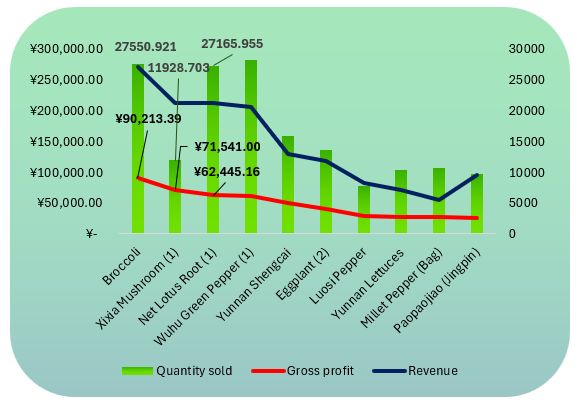
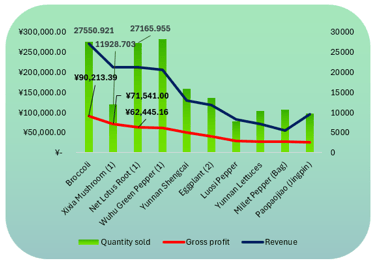
Is profitability driven by high price or high volume?
Broccoli: High volume + high revenue
Strong profit contributor driven by both scale and pricing.Xixia Mushroom: Lower volume but strong revenue
Indicates higher price positioning and stronger margin per unit.Net Lotus Root: High volume with moderate profitability
Volume-supported profitability
Profitability is driven by a mix of volume strength and pricing power, not volume alone
Is profitability concentrated or diversified?
The top products contribute a significant share of total gross profit
This suggests moderate concentration risk, meaning:
Strategic dependence on a limited number of SKUs
Potential vulnerability if one key product underperforms
Top 10 Products by Volume
Are the most sold products also the most profitable?
Not necessarily
Broccoli appears in both top volume and top profit (Balanced strategic product)
Net Lotus Root also appears in both (Volume supports profitability)
Wuhu Green Pepper ranks highest in volume but does not appear among the top 3 profit contributors
What This Reveals
High volume does not guarantee high profitability
Wuhu Green Pepper likely operates with:
Lower price
Lower margin
Volume-driven strategy
Meanwhile:
Xixia Mushroom demonstrates that profitability can be achieved without high volume — suggesting pricing strength.
The products driving operational scale are not always the ones driving financial performance
Average Selling Price (ASP) & Price Markup Over Time
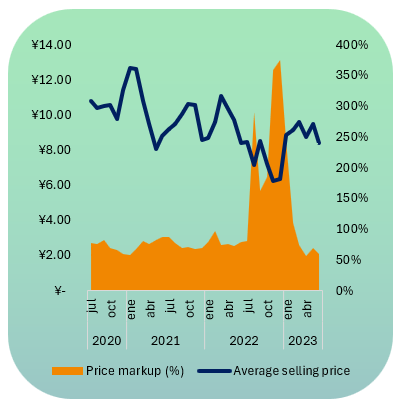
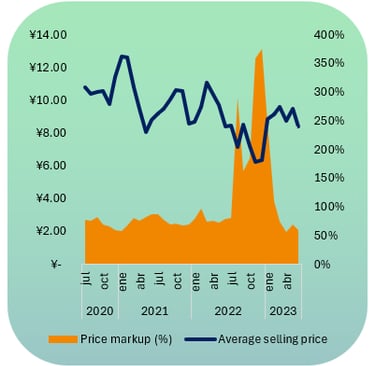
Strategic Interpretation
At first glance, declining ASP may suggest pricing pressure
However, rising markup indicates:
Cost reduction initiatives
Improved supplier negotiation
Operational efficiency gains
Better pricing structure relative to cost
Most importantly:
The period of significant markup increase (Jul 2022 – Jan 2023) coincides with the highest gross margin period.
What This Means
When margin and markup rise together, it signals:
Structural profitability improvement
Better cost-to-price ratio management
Sustainable value creation rather than temporary price spikes
This period reflects:
A shift from volume-driven growth to profitability-driven discipline.
Conclusions
This analysis demonstrates that performance evaluation requires more than tracking revenue.
By integrating revenue, gross profit, margin behavior, product mix, and pricing trends, the dashboard reveals:
Revenue peaks can mask margin erosion
Margin expansion can occur even during revenue contraction
Portfolio strategy determines profitability sustainability
Pricing discipline directly impacts long-term value creation
Between 2020 and 2023, the business transitioned toward stronger profitability fundamentals — supported by markup expansion and improved margin efficiency
Executive Takeaway
The central question was:
Are we growing profitably?
The answer:
Yes — but not consistently.
The company experienced margin-dilutive growth early on, followed by structural profitability improvement driven by pricing and cost optimization.
This case highlights the importance of monitoring growth quality, not just growth size.